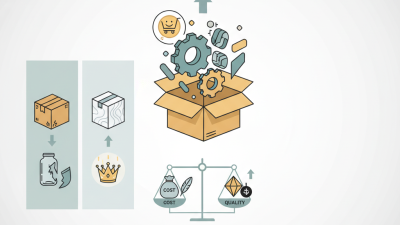
To create packaging in 2026, companies must balance protection, identity, cost, and environmental responsibility. Packaging is no longer a decorative layer around a product. It shapes first impressions, shelf visibility, opening behavior, storage, and disposal. A rigid carton may protect glass during delivery, while a soft pouch may reduce material use. Each choice carries practical consequences.
Lars Wallentin, former Head of Packaging Design at Nestlé, said, “Packaging is the last and most intimate communication between the product and the consumer.” His observation remains valuable because customers often meet the package before they meet the product. A clear label, controlled color palette, and comfortable grip can communicate quality within seconds. However, appearance alone is not enough. Professional teams examine compression strength, moisture resistance, seal performance, print accuracy, and transport conditions. They also check whether instructions remain readable under ordinary lighting.
The best packaging companies test ideas with real users and real handling situations. They create prototypes, collect feedback, and revise weak details before production. Small flaws matter. A lid that feels tight may frustrate older customers. A glossy surface may look premium but show fingerprints easily. A recyclable structure may still fail when local facilities cannot process it. This is where experience and honest evaluation become essential. No design is perfect. Strong packaging comes from measurable testing, responsible material choices, reliable suppliers, and a willingness to question attractive but impractical decisions. The following outline explores how leading companies turn those principles into packaging that protects products and earns customer trust.

The global packaging market is entering a decisive phase. Industry forecasts place its value near $1.2 trillion by 2028. This growth reflects rising demand for food, medicine, cosmetics, and shipped goods. Packaging companies must respond to volume without sacrificing safety or usability. The number is impressive. Yet forecasts are not guarantees.
Creating effective packaging begins with a clear product assessment. Measure weight, moisture exposure, temperature changes, and transport distance. Choose materials that protect the product during storage and handling. Test seals, closures, labels, and stacking strength before production. A small weakness can damage thousands of units. Packaging engineers should also review recycling access in the target market.
Cost control matters, but cheap materials can create expensive failures. I have seen attractive packages lose their shape after damp warehouse storage. That result changes customer trust quickly. Digital prototypes and limited production trials can reveal problems early. However, testing conditions may not match real distribution routes. Teams should collect feedback from warehouse workers, retailers, and end users. Their observations often expose practical issues that laboratory tests miss.
The projected $1.2 trillion market will reward companies that combine protection, efficient production, and responsible material choices. Packaging design must remain flexible as regulations, shipping patterns, and consumer expectations change. Not every sustainable-looking option performs well. Claims require evidence, supplier records, and measurable results. A better process keeps questioning the first successful sample.
Global packaging outlook, material trends, regulatory indicators, and packaging design priorities
| Market Dimension | 2026 Data Point | Unit / Scope | Packaging Development Implication |
|---|---|---|---|
| Global packaging market value | US$1.2 trillion forecast by 2028 | Global market value | Packaging strategies should balance volume growth with cost control, material efficiency, recyclability, and regulatory readiness. |
| Market planning horizon | 2026–2028 | Three-year planning window | Prioritize packaging platforms that can be scaled across markets without major redesigns or material substitutions. |
| Global plastic circularity | Approximately 9% of plastic waste was recycled | Global, 2019 OECD baseline | Use fewer material combinations, avoid unnecessary additives, and design formats that are compatible with established collection and recycling systems. |
| European packaging waste generation | 186.5 kg per person | European Union, 2022 | Lightweighting, concentrated products, refill systems, and right-sized packaging can reduce material use per saleable unit. |
| EU packaging recycling rate | 67.5% | European Union, 2022 | Packaging concepts should be tested against local sorting, collection, recycling, and labeling requirements rather than judged only by material type. |
| Paper and paperboard recovery | Approximately 82% recycling rate | Europe, 2022 | Paper-based formats can offer strong recovery potential when coatings, laminations, inks, adhesives, and food-contamination risks are properly managed. |
| Packaging material priority | Paper and board, flexible plastic, rigid plastic, metal, and glass | Common global material categories | Select materials according to product protection, shelf-life requirements, filling-line compatibility, transport conditions, and end-of-life infrastructure. |
| Plastic packaging design | Mono-material structures are generally easier to sort and recycle than complex multi-material structures | Design principle | Simplify layers and components where performance allows, while validating barrier, seal strength, durability, and product-safety performance. |
| EU regulatory milestone | 12 August 2026 | General application date of the EU Packaging and Packaging Waste Regulation | Packaging documentation should cover recyclability, material composition, labeling, waste prevention, and applicable recycled-content obligations. |
| Primary packaging performance | Product-specific validation required | Food, beverage, personal care, healthcare, and household applications | Test oxygen and moisture barrier, light protection, compression, leakage, migration, shelf life, and transportation performance before commercialization. |
| Recommended 2026 packaging scorecard | Five evaluation criteria | Protection, cost, carbon, circularity, compliance | Use a weighted scorecard to compare packaging concepts and prevent improvements in one area from creating unacceptable trade-offs in another. |
Source and methodology note
Market value: Smithers forecast cited in the brief, projecting the global packaging market to reach US$1.2 trillion by 2028. Circularity and waste indicators: OECD Global Plastics Outlook, Eurostat, and European paper-recycling industry statistics. Figures refer to the stated geography and year; categories are not intended to be added together because packaging market classifications may overlap.
Packaging goals should be measurable before a design team chooses materials, shapes, or finishes. ISO 18601 recommends evaluating packaging through its full life cycle, from raw material extraction to end-of-life treatment.
A practical brief can set three targets: reduce material mass, protect the product, and improve recovery after use.
Each target needs a baseline, owner, and review date.
Use life-cycle assessment to test trade-offs rather than celebrate lighter packaging alone.
The OECD reported that global plastic production reached 460 million tonnes in 2019, while only 9% of plastic waste was recycled.
A thinner package may reduce transport emissions, yet it can increase product damage. That hidden impact matters.
Measure package weight, recycled content, transport distance, damage rates, and recovery options across comparable scenarios. Small details count, such as a 12-gram closure or an unnecessary inner tray.
The first target is rarely perfect. Packaging teams should document assumptions, data quality, and uncertainty under ISO 18601 principles.
The United Nations Environment Programme projects municipal solid waste could rise from 2.3 billion tonnes in 2023 to 3.8 billion tonnes by 2050.
This pressure makes vague sustainability claims increasingly weak. Review results with suppliers, recyclers, and logistics specialists, not only designers.
One gap often remains: regional recycling data can be incomplete. Record it openly, then improve the assessment during the next design cycle.
Creating packaging in 2026 starts with a material decision, not a decorative concept. OECD data shows that only 14% of plastic packaging is recycled globally. Much of the rest is lost, burned, buried, or mismanaged. That number challenges easy claims about “recyclable” packs. A package may be technically recyclable yet fail in a local collection system. Reality is messier.
A professional material review should examine the full route: production, filling, transport, use, collection, sorting, and reprocessing. Choose one dominant material when possible. Avoid dark pigments, inseparable layers, excessive sleeves, and small components that machines cannot identify. Clear labels should match local recycling instructions. Test the empty pack after use, not only the fresh sample on a studio table. In my packaging trials, a thinner pouch often saved material but created sealing problems. A heavier container felt safer, yet increased transport weight. Neither choice was automatically better. Small flaws matter.
Packaging teams should request supplier evidence, recycling compatibility data, and realistic recovery rates. They should also compare recycled content with food-contact and performance requirements. These checks support credible decisions. Still, data can be incomplete, especially across regions. I would rather record uncertainty than promise a perfect circular solution. The 14% figure is uncomfortable. It should influence material selection, package size, and honest customer guidance. Better packaging may begin with fewer parts, clearer tests, and the humility to redesign what looked successful.
For the best packaging companies in 2026, production design must begin before artwork is approved. PMMI data highlights the value of connected equipment, repeatable changeovers, and measurable line performance. These ideas can turn attractive packaging into a reliable production asset.
A practical design review should examine material thickness, sealing temperature, machine speed, and pack orientation. Small details matter. A narrow opening may slow feeding, while a soft film can wrinkle around the sealing jaws. Use PMMI benchmarks to compare downtime, changeover duration, throughput, and overall equipment effectiveness. Operators should test the package on real equipment, not only through digital drawings. A five-minute trial can reveal a costly weakness.
Automation also needs clear data points. Add sensors where jams commonly occur, then record stoppage causes by shift and product format. Standardized package dimensions can reduce tool changes and simplify robotic handling. However, more automation is not always better. An overcomplicated line may require specialized maintenance and create longer recovery times. I have seen efficient concepts lose performance because cleaning access was ignored. Measure the pause. Review the failure. Improve the design without hiding its imperfections.
PMMI research can support informed decisions, but each facility still needs local validation. Material supply, workforce skills, sanitation routines, and floor space can change the result. The strongest packaging design balances shelf appeal with stable feeding, safe operation, fast changeovers, and transparent performance data.
Choosing the best packaging company in 2026 requires more than comparing unit prices. A reliable ranking should examine total cost, regulatory compliance, EPR obligations, and verified LCA data. In practice, I compare quotations using the same order volume, material grade, printing method, and delivery terms. A low price can become expensive after tooling, waste, storage, and transport charges appear.
Compliance deserves equal attention. Ask for current test reports, material declarations, food-contact records when relevant, and documented quality controls. EPR performance also matters. Check whether the supplier can provide accurate material weights, recycling classifications, and country-specific reporting support. LCA results should identify system boundaries, data sources, allocation methods, and independent verification. Vague carbon claims are not enough.
Tips: Build a weighted scorecard. Give cost 30%, compliance 25%, EPR support 20%, verified LCA quality 25%. Keep evidence beside every score. Speak with production staff, not only sales contacts. Request a pilot batch and inspect seals, print accuracy, carton strength, and actual waste. My own evaluations are rarely perfect; supplier data can be incomplete, and regional rules change. That uncertainty should reduce confidence scores, rather than disappear from the ranking.
Packaging compliance benchmark by material: EU recycling targets for 2025 and 2030.
Paper and cardboard have the highest EU recycling targets by 2030, while plastic packaging has the lowest target among the listed materials. Packaging decisions should also evaluate total cost, extended producer responsibility fees, legal compliance, and verified life-cycle assessment data. Recycling targets are regulatory benchmarks, not company performance scores.
Source: European Commission, Directive 94/62/EC on packaging and packaging waste, recycling targets applicable from 2025 and 2030.
Get Free Estimate!